Tips for technical interviewing

Two people fencing.
Photo by Micaela Parente on Unsplash

The dreaded technical interview. Does anything else strike such fear into the heart of the job-seeker? When I started my data science job search, I was downright terrified of technical interviews. They seemed like such minefields, packed with opportunities to look like a dunce in front of someone who could give me a job. Now that I’ve been through a handful of them (some passed, some failed), I have some perspective on how to approach them with less dread and more positivity.

Continue reading “Tips for technical interviewing”

My post-bootcamp learning plan

A hand adds a sticky note to a group of sticky notes on a wall.
Photo by Kelly Sikkema on Unsplash

Earlier this year I completed Flatiron School’s full-time online data science bootcamp. The program took about 40 hours per week for 5 months, and it covered pretty much everything I expected from a data science bootcamp (plus some things I hadn’t even heard of before I started!). It’s impossible, of course, for any bootcamp to cover everything a data scientist needs to know, and that’s not really the point. Flatiron School’s stated objective for the bootcamp is to introduce students to a wide range of material and teach them how to learn new skills on their own.

After graduating and while starting my job search, I set out to fill some gaps in my preparation. Reading job ads taught me a lot about what employers are looking for and what specific skills were required for the sorts of jobs that appealed to me most. In this post I’ll share some of the resources I have used post-bootcamp to broaden and deepen my data science knowledge.

Continue reading “My post-bootcamp learning plan”

How to approach a data science take-home project

Brown takeout box with wire handle
Photo by Kelly Sikkema on Unsplash

You’ve made it past the initial phone screen for a data science job (congrats!), and now they’ve given you a take-home project. It’s your chance to blow their minds, knock their socks off, convince them that you’re a slam-dunk hire—but where to start? When tackling a take-home project, it’s important to be strategic so that you can deliver your best work in the time allotted.

Not everybody is a fan of take-home projects, especially if you won’t be paid for the time you spend. I attended a panel recently where one presenter said he always declines to do take-home projects and instead offers to discuss over the phone how he would approach the project. How you respond to a request to do a take-home project is up to you, of course. Personally, I have found them to be a good opportunity to show that I really know how to do the things I say I know how to do. And luckily, I have had the time to spend on them.

In this post I’ll walk you through the process of planning and executing a take-home project. Ready, set…read on!

Continue reading “How to approach a data science take-home project”

Pop X Pitchfork: Topic modeling for music reviews

Pink headphones on a pink and green background.
Photo by Icons8 Team on Unsplash

From time to time I read Pitchfork.com to get new music recommendations. Now, I’m no music snob. If it’s on the Top 40, it’s good enough for me. But Pitchfork’s music reviewers tend to be strong writers and extremely knowledgeable, so it can be really enlightening to get their perspective on a certain artist or album.

Recently, I came across a collection of over 18,000 music reviews scraped from Pitchfork on Kaggle. The possibilities for analyzing how Pitchfork writers write about music were too good to resist. Today I’ll walk you through how I modeled topics on the subset of reviews about music in the “Pop/R&B” genre. I’ve got some insights for you on who (according to Pitchfork) are the paragons of pop. Read on!

Continue reading “Pop X Pitchfork: Topic modeling for music reviews”

Online networking resources for women in data science (and everybody else)

Drawing of hands touching
Photo by 🇨🇭 Claudio Schwarz | @purzlbaum on Unsplash

During the 2008 financial crisis, I was fresh out of college and looking for a job. It was definitely a challenging time to be job-searching. I remember going out in my interview clothes with a stack of résumés and walking door-to-door in shopping centers looking for hourly retail work without much luck. After a few months of surviving on babysitting gigs, tutoring sessions, and credit cards, a friend recommended me to her manager at Starbucks, and I finally got a reliable part-time job. My network saved me then, and I’m working it again now as I job-search during a global crisis even bigger and scarier than the last one.

Networking is different now. I met my Starbucks coworker because she lived in my apartment building. Although I started off this job search with in-person meetups, a month ago I had to shift my strategy totally online. Here are some of the resources that have been most useful to me. I hope they will help you, too.

Continue reading “Online networking resources for women in data science (and everybody else)”

Customer segmentation using the Instacart dataset

I recently had the opportunity to complete an open-ended data analysis project using a dataset from Instacart (via Kaggle). After a bit of exploration, I decided that I wanted to attempt a customer segmentation. Luckily, I found an article by Tern Poh Lim that provided inspiration for how I could do this and generate some handy visualizations to help me communicate my findings. In this post I’ll walk through how I adapted RFM (recency, frequency, monetary) analysis for customer segmentation on the Instacart dataset. Since the dataset doesn’t actually contain timestamps or any information about revenue, I had to get a bit creative!

Continue reading “Customer segmentation using the Instacart dataset”

How I built it: Pinball Wizardry

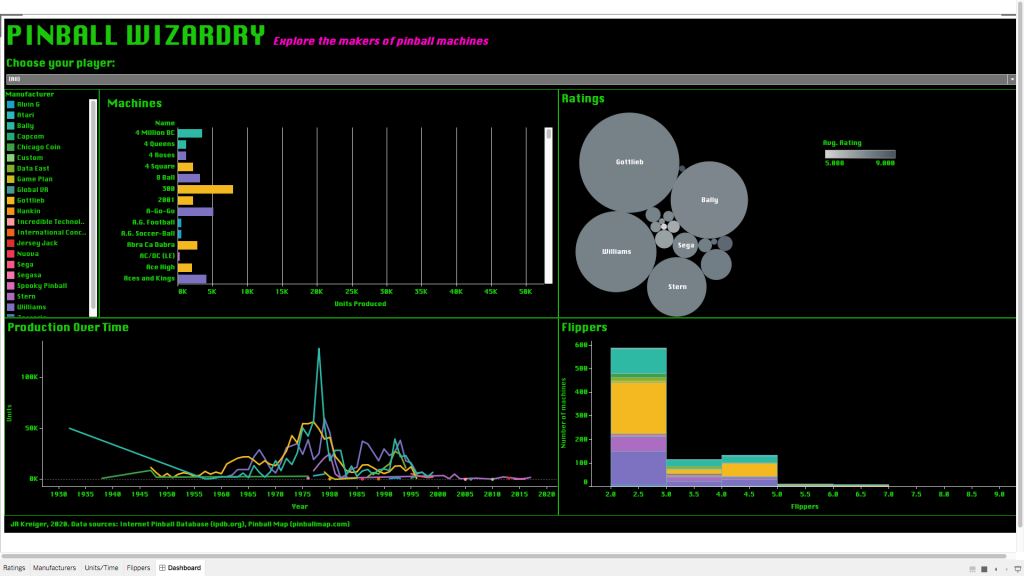
Recently, I was looking for a fun project to help me practice a couple of skills that I don’t get to use very often. In particular, I wanted a chance to call an API, scrape some data from a website, and do some cool visualizations in Tableau. What started off as a chance encounter with some data about pinball machines led me on an adventure that ended with an 80s-themed dashboard (below). In this post, I’ll walk you through how I built Pinball Wizardry, which took about 12 hours over the course of a week.

Screenshot of a Tableau dashboard.
View the interactive dashboard at Tableau Public.
Continue reading “How I built it: Pinball Wizardry”

Quick and easy model evaluation with Yellowbrick

Now and then I come across a Python package that has the potential to simplify a task that I do regularly. When this happens, I’m always excited to try it out and, if it’s awesome, share my new knowledge.

A couple of months ago, I was browsing Twitter when I saw a tweet about Yellowbrick, a package for model visualization. I tried it, liked it, and now incorporate it into my machine learning workflow. In this post I’ll show you a few examples of what it can do (and you can always go check out the documentation for yourself).

Continue reading “Quick and easy model evaluation with Yellowbrick”

Predicting the "helpfulness" of peer-written product reviews

Some e-commerce sites let customers write reviews of their products, which other customers can then browse when considering buying a product. I know I’ve read product reviews written by my fellow customers to help me figure out if a product would be true to size, last a long time, or contain an ingredient I’m concerned about.

What if a business could predict which reviews its customers would find helpful? Maybe it could put those reviews first on the page so that readers could get the best information sooner. Maybe the business could note which topics come up in those helpful reviews and revise its product descriptions to contain more of that sort of information. Maybe the business could even identify “super reviewers,” users who are especially good at writing helpful reviews, and offer them incentives to review more products.

Using a large collection of product reviews from Amazon, I trained a range of machine learning models to try to identify which reviews readers rated as “helpful.” I tried Random Forests, logistic regression, a Support Vector Machine, GRU networks, and LSTM networks, along with a variety of natural language processing (NLP) techniques for preprocessing my data. As it turns it, predicting helpful reviews is pretty hard, but not impossible! To go straight to the code, check out my GitHub repo. To learn more about how I did it, read on.

Continue reading “Predicting the "helpfulness" of peer-written product reviews”