I recently completed Flatiron School’s Online Data Science Bootcamp. It was intense and fun and challenging and inspiring, and now that I’ve had a few days to recover, I want to share some data about my experience for anyone who may be considering a bootcamp for themselves.
The prep phase
My bootcamp journey actually started long before Flatiron School. On April 15, 2014, I joined Codecademy and started trying out some basic HTML and CSS exercises. I was having a tough year in the middle of my PhD program, and I thought a little bit of coding might give me the emotional boost I needed to keep pushing through my work.
I was right! Coding gave me a sense of accomplishment and the joy of learning something new, feelings that were in short supply as I tried to write my dissertation. I eventually worked my way through 6 courses and over 1,000 exercises on Codecademy. Foreshadowing things to come, I found that I loved Python the most of all the languages I tried.
After I graduated, I started getting more serious about the possibility of data science as a career. I took a course on math for data science on Coursera and tried to remember all the stuff I’d learned in my last math class over a decade before. When January 2018 rolled around, I decided I was ready to commit to the cost of a DataCamp subscription. I blasted through tutorials in R and Python as fast as I could go, trying to get as much exposure as possible so that I could decide if data science was right for me. I ended up completing 66 courses on DataCamp, and while all those in-browser exercises didn’t really give me solid programming skills, they did give me a basic familiarity with most of the concepts I eventually encountered in bootcamp.
Applying to bootcamps
In spring of 2019, I got serious about applying to bootcamps. Some things had changed at my job, and I had the opportunity to stay and do a part-time bootcamp or leave and take on a full-time one. I did a lot of comparison shopping and applied to three bootcamps: Lambda School, Thinkful, and Flatiron School. Lambda and Flatiron both had preparatory work that applicants could do for free while waiting to enroll, so I set about working through a couple dozen exercises at each.
Flatiron School ended up having the right combination of content, timing, and price for me, so once I passed my technical interview, I was ready for bootcamp!
The bootcamp experience
I enrolled in the full-time online data science bootcamp at Flatiron School, which runs for about 5 months (in my case, August 2019 to January 2020). They say you should expect to study for about 50 hours a week, but in my case, that turned out a bit lower on average, probably because I had some preparation.
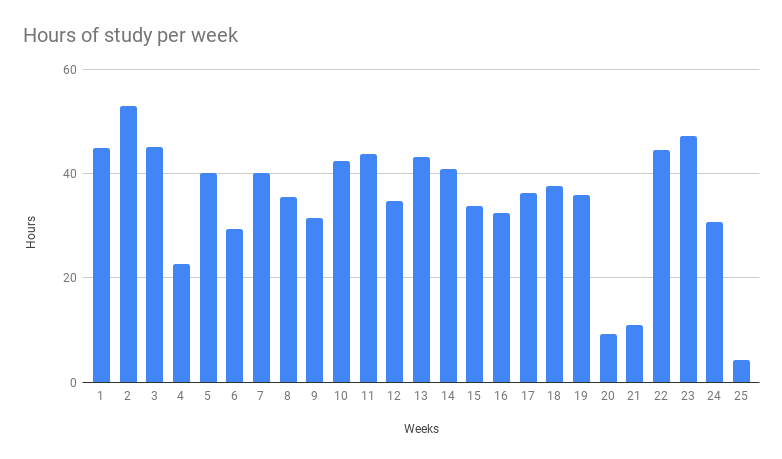
A couple of things to note about the plot above:
- I counted weeks from Friday to Thursday, since Friday was when new units of the curriculum opened up for me.
- Those short weeks (4, 20, 21, 25) represent weeks when school was technically not in session because of holidays, but I worked a bit anyway. Week 25 was a one-day week (my last day of bootcamp, a Friday).
- My average study time per week was about 43 hours, if you don’t count weeks when school was not in session.
Every week I had four hours of study group meetings plus an hour of social time with my cohort. I also had two half-hour check-ins with my instructor every week. At the start of the program I met with my educational coach for about half an hour a month, and at the end of the program I started meeting with my career coach for 45 minutes every other week or so. These meetings all gave a little structure to my time, but I was basically free to plan each day as I liked. This was great for me; I worked very little on weekends, and anytime I needed a break, I could easily take one.
Let’s take a look at the shape of my average week:
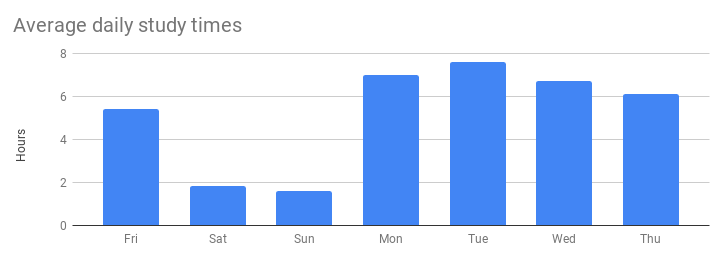
Like I mentioned above, I counted my weeks as starting on Friday, when new exercises were released. Friday was my busiest day for meetings, so I usually didn’t spend as much time studying. I kept the weekends pretty light so I could spend time with my partner, relax, and come back ready to work hard on Monday. Every day my goal was to get through the material we would cover at the next day’s study group.
Speaking of the curriculum itself: it included 6 modules, each lasting about 2 weeks, covering Python programming, data engineering, statistics, machine learning, and deep learning.

The first module took the most time by far, and no wonder: it covered both Python programming and linear regression, so there was a ton to do! The lessons and labs in module 5 (machine learning) didn’t take very long, but the project for that module more than made up for that.
The modules combined contained a total of 50 sections. Each section could include a handful to a dozen or more readings and labs. I usually had to get through about one section per day. Have a look:
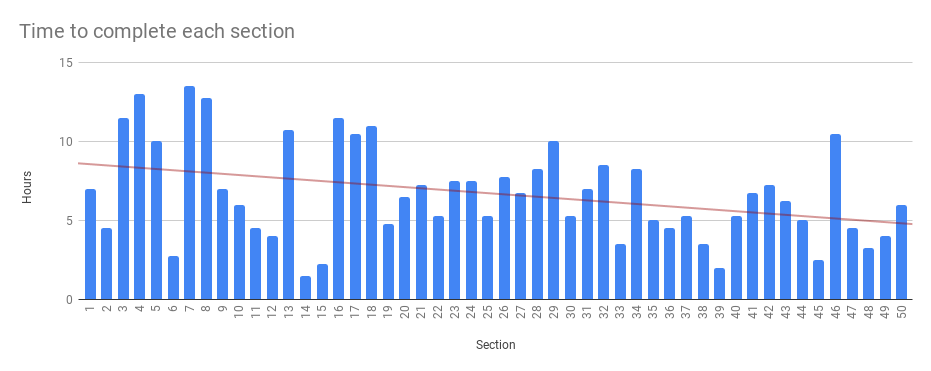
At the beginning, I really took my time to make sure I understood everything (and there was just a lot to cover). Later in the program, the content was more complex, but it was conveyed in fewer lessons and labs.
Now for my favorite part of the program: the projects! I had to do four portfolio projects plus a bigger capstone project. Here’s a breakdown:
- Project 1: a data wrangling and linear modeling project using the King County, WA, housing dataset. The data and the research question were provided; overall it was a highly structured project and a pretty challenging initiation to the data science lifecycle.
- Project 2: a statistical analysis project using the Northwind database (a sample database created by Microsoft). The data and two research questions were provided, and I had to develop three additional questions on my own. This project tested my ability to extract data with SQL and correctly execute hypothesis tests to address business problems.
- Project 3: a time series modeling project using data from Zillow. The dataset was provided, but it was up to me to define a business case focused on real estate investors, wrangle data relevant to my case, and perform time series analysis. It was fun to have a little more independence for this project!
- Project 4: a machine learning project. I got to choose my dataset and define a problem to address with machine learning. This one was fun and really challenging, since it was so open-ended.
- Capstone: an entirely open-ended project. After completing the other projects, I decided that NLP and neural networks were subjects I wanted represented in my portfolio. I got inspired by Yelp, where readers can rate reviews as “helpful” or “funny,” so I found a dataset (of Amazon reviews, as it turns out) and used NLP and deep learning to try to predict whether readers would rate a product review “helpful” or not.
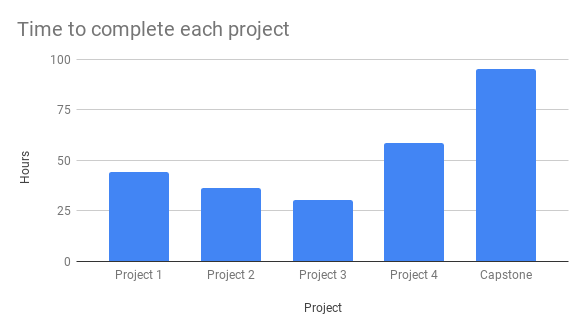
The capstone took me 95 hours, by far the longest of the projects! Although I definitely reached a point of frustration at some point in each project, overall they were the most rewarding part of the curriculum because I got to show myself (and anyone who looks at my portfolio) that I really can do data science!
Add to these figures over 400 pages of handwritten notes, 5 of my favorite pens, a pad of sticky notes, and a pack of index cards, and you’ve got my bootcamp experience by the numbers.